
Breaking down risk and returns across stages of venture capital
.png)
Brian Nichols is the co-founder of Angel Squad, a community where you’ll learn how to angel invest and get a chance to invest as little as $1k into Hustle Fund's top performing early-stage startups
Welcome to the third installment of Big Bets, a special series of “Small Bets” that breaks down later-stage investing concepts.
Big Bets is brought to you by Jamie Melzer and Katie Nowak of HF Scale Partners. HF Scale invests in pre-IPO venture-backed technology companies through primary rounds and secondary transactions.

First, a time-traveling recap
In our second Big Bets, we explored how different venture is today vs. its humble beginnings in the 1970s. In short, capital available to invest in startups has increased by 10x over the past 15 years, leading to companies staying private for longer and growing to much larger valuations. This has also led to extremely different risk profiles across stages of venture capital.
Not all venture capital risk is created equal
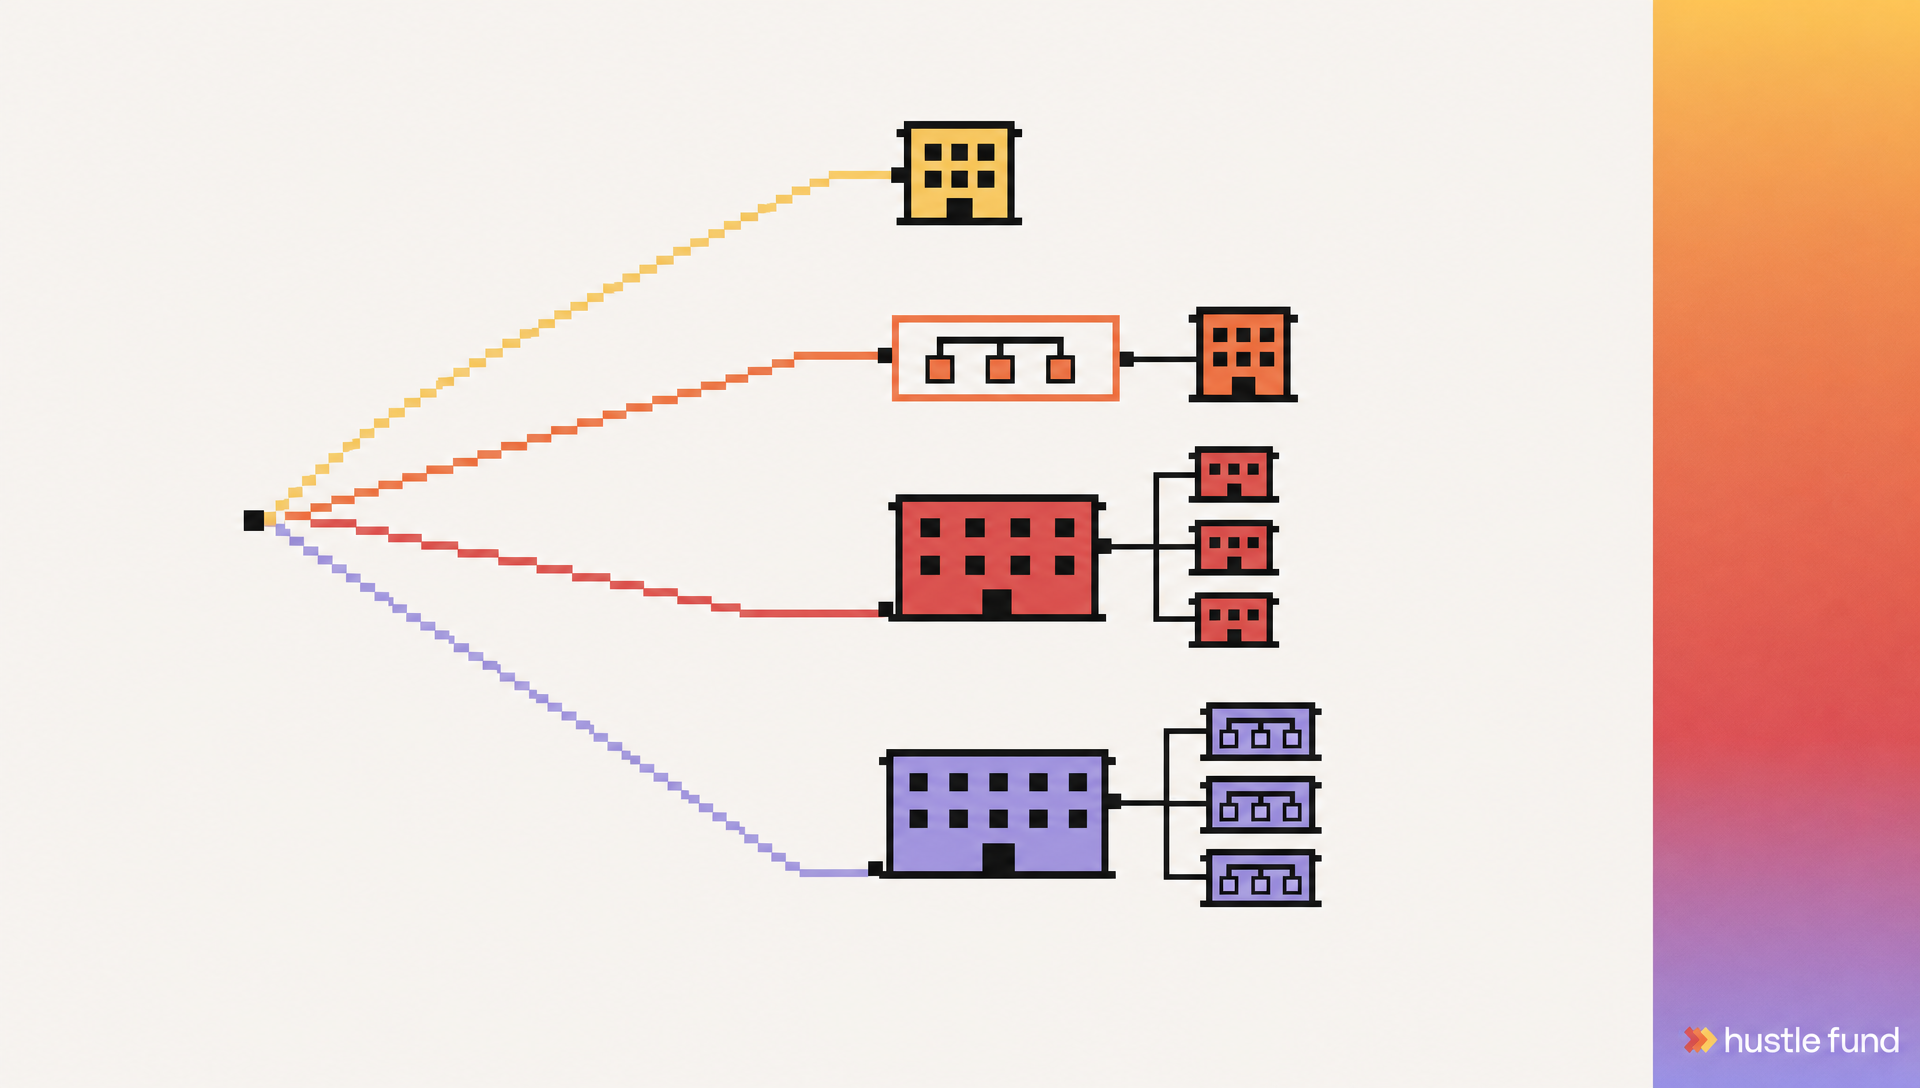
As a company grows, it inherently de-risks through established revenue, customer retention, seasoned management teams, margin expansion, and profitability, among other things. This is what we call scaling.
A startup with $1M in revenue (early stage) looks very different from a company with $100M in revenue (growth stage). Both of those companies look very different from a company with $1B in revenue that has reached profitability (late stage). So, how do venture capital investors assess the risk and expected returns across these different stages of a company's life cycle? 🤔
Benchmarking risk
Recall from our first Big Bets that risk is uncertainty about which outcome will occur and the probability of loss when unfavorable ones do. Or, put more succinctly, the probability of a permanent loss of capital. (Both definitions borrowed from the amazing investor Howard Marks) Below, we’ve broken down some key risk components across stages.

The level of risk for each investment is determined primarily by the probability of a permanent loss of capital (risk of loss), with the duration of the investment (holding period), and liquidity (ease of selling some or all of the investment before an exit) playing a secondary role.
(Recap: MOIC is multiple on invested capital, or the multiple of cash returned on an initial investment. For example, if you invest $10,000 in XYZ company and sell it for $100,000, then $100,000/$10,000 is 10x MOIC. It is a simple cash-on-cash return metric that does not account for how long it takes to realize the gain on investment.)
For a deeper introduction to the language used in this post, our VC terminology guide covers the foundational concepts every angel needs to know.
The higher the overall risk, the higher the target multiple on invested capital (MOIC) and internal rate of return (IRR) required to justify investing.
Let’s break it down by stage…
Early stage
Early-stage companies have the highest risk profile, in large part because most of them will fail and return little or nothing back to investors (risk of loss). Approximately 65% of early-stage startups will fail and return 0-1x MOIC to early investors.
This is why understanding how to evaluate a startup with no traction is the most important skill at the early stage.
The investing gains on the startups that survive need to cover the investors' losses on the majority of investments that fail and generate combined returns that are attractive enough to take on the risk in the first place. Only 1-2% of venture-backed companies generate the majority of returns across the industry. This dynamic is called the Power Law and is why early-stage investors must target a 100x MOIC on each investment.
We've written more about the power law in startup investing and why a small number of winners drive the entire venture capital model.
Early-stage companies also have the longest time horizon to a potential exit (duration risk) and the least ability to sell some or all of an investment to another investor (liquidity risk).
Growth stage
Once a company reaches the Series B stage, the probability that it will fail declines dramatically. At this stage, the company has been operating for around five years +/- and is that much closer to a potential exit, thereby reducing an investment's holding period (duration risk). Around this stage, companies may start thinking about options for liquidity for early employees and investors to sell some of their equity, though liquidity is still quite limited.
This is where the secondaries market becomes relevant; we've broken down how to sell your shares before a company exits in detail.
All in all, at the growth stage, the probability of loss has been reduced dramatically, the duration is shorter, and there are occasional options for liquidity. Because fewer companies fail, investors don’t need 100x returns to offset the losses. The target return for each investment drops to around 5-10x, depending on the stage, time to exit, etc, with target IRRs in the 25% range.
Late stage
Once a company reaches this stage in its life cycle (we use Series E and/or 10 years in business as a rough benchmark internally), the risk of failure has dropped significantly to ~1-5%. Many companies at this stage are approaching an IPO or an alternate liquidity event (strategic M&A, private equity buyout, etc).
Liquidity can still be challenging, but more and more companies allow for secondary trades or even structure tenders to help employees and investors achieve some liquidity.
Our deep dive into the secondaries market explores how these transactions actually work and what investors should evaluate before participating.
At the operating level, the risk profile looks much like public companies, with a slight risk premium required for the lack of liquidity and duration to exit. Investors may look for 1.5-5x MOIC and ~20% IRRs, depending on the expected exit timing.
A quick discussion of duration risk
How does duration factor into the risk equation? Logically, the longer you hold an investment, the more risk you are taking. But why? Think about it like this:
If you buy a share of XYZ equity and sell it a month from now, it may go up or down, but the range of possible outcomes that can occur in a month is fairly limited. There is a nearly 0% probability that you will lose all of your money and a nearly 0% probability that you will 100x your investment. But what if you stretch that holding period to 10 or 25+ years? Can you imagine a scenario where the company goes the way of Blockbuster and is replaced by a disruptive new technology? Alternatively, demand for its unique product skyrockets like Nvidia?
Time increases the range of possible outcomes. Let’s look at how time impacts returns across stages.

The above chart shows the internal rate of return (IRR) of an individual investment based on different MOIC outcomes (the multiple of cash returned on the initial investment) and holding periods (years to exit). You may notice that early-stage investments require a higher MOIC to achieve their target IRRs, while late-stage investments require a much lower MOIC to achieve attractive returns.
This is the power of time.
In conclusion
Which stage of venture capital makes the best investment? It just depends on your investing goals.
Do you value liquidity and shorter duration over 10x-ing your investment? Late-stage may be better suited for your venture portfolio. Are you investing extremely long-term capital with a focus on compounding wealth? Early-stage investments may be a good fit for you. Both should have a place in a diversified investment portfolio. The point is that not all venture capital investments are created equal.
Signing off for now…don’t miss our next (and final!) Big Bets of the summer next month!
See you next time,
Jamie + Katie
Big Bets is brought to you by Jamie Melzer and Katie Nowak of HF Scale Partners. HF Scale invests in growth and late-stage venture-backed technology companies through primary rounds and secondary transactions. Want to learn more? You can find us here.


.png)


.png)